
Introduction
Effective email marketing is crucial to your business success, with 42% of businesses saying email is one of their most effective lead generation channels. One of the advantages of email marketing is how quickly and precisely you can measure the performance of your campaigns. But this is only an advantage if you know what to measure, why to measure it, and how to make informed changes that increase the impact of your marketing. In this article I’ll list the five most important email marketing statistics for you to track.
Why You Should Consider Tracking Your Email Marketing Statistics
Email marketing is a superior tool for generating leads. It also provides excellent return on investment (ROI), with the Data and Marketing Association (DMA) reporting that email marketing has an average ROI of $38 for each $1 spent. Many other trends reinforce the growing importance of email marketing, with HubSpot’s State of Email Marketing 2020 survey finding that 73 percent of millennials prefer communications from businesses to come via email, over 50 percent of U.S. respondents check their personal email account more than 10 times a day, and 80 percent of business professionals believe that email marketing increases customer retention.
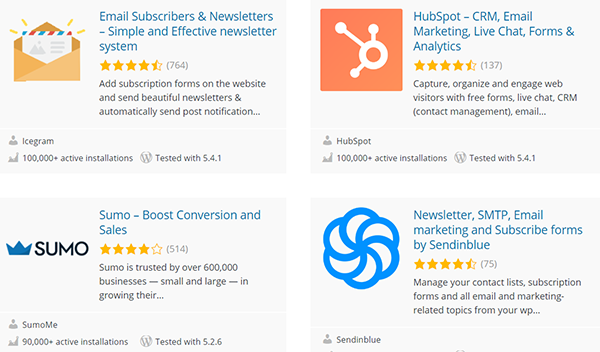
There are many solutions you can use to coordinate your email marketing campaigns, including leading service providers like HubSpot, Sumo, Mailchimp, Constant Contact, and Sendinblue. Many email marketing services provide WordPress plugins that deeply integrate your email campaigns and reporting with your website. Free access is often available as part of a tiered account system, and at higher levels some solutions provide comprehensive customer relationship management (CRM) functionality.
Along with the many tools available for email marketing, you potentially have access to so many statistics that it can be challenging to decide which you should be tracking. The key statistics you should track are the ones that tell you how your email is performing at each of the fundamental steps in your email marketing campaign. Your campaign starts when you click Send on your email, and it ends as each of your readers takes the action you want them to take, or don’t.
5 Email Marketing Statistics You Should Be Tracking Immediately
Each email you send as part of an email marketing campaign kicks off a chain of events that you want to see reach the outcome you’ve chosen. The statistics that tell you what happened at each step are the ones that must be tracked. Did your email reach the person? Did they open it? Did they unsubscribe? Did they click through to your site? Did they take the action there that you wanted?
Depending on the solution you use to manage your email marketing campaigns, you will have different options when it comes to creating dashboards and reports. Remember that your dashboards and reports are only of value if you engage with them. Your tracking will be most effective if you build into your own workflow regularly scheduled time for reviewing your key statistics and deciding what actions are required. These statistics should include:
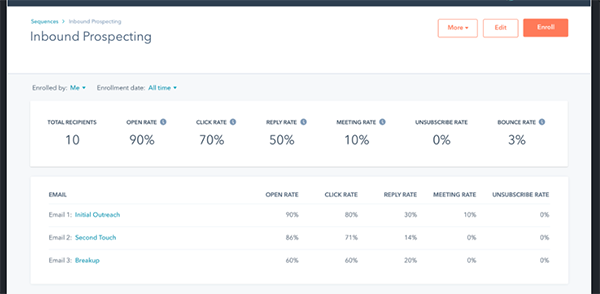
1. Bounce Rate
How many of your emails were successfully delivered, and how many weren’t? That’s your bounce rate, expressed as a percentage. Best practices vary, but if your bounce rate is more than 3 percent it’s worth looking at more closely and working on your mailing list. Some service providers have pre-set limits, and if your bounce rate is more than 10 percent you may be putting your account in jeopardy.
Bounces are often categorized as hard or soft. Hard bounces happen when an email address is rejected as invalid or doesn’t exist. You may have a typo in your list, or could have been given an incorrect address.
Soft bounces happen when your email is rejected for another reason, some that are under your control and some that aren’t. Soft bounces happen when your email is too large, or when the person has a full mailbox, has turned on a vacation auto-reply, or has blocked you as a sender.
2. Open Rate
How many people opened your email? That’s your open rate, and different factors will influence it. If your email is flagged as spam or arrives in the middle of the night, there is less of a chance it will be opened.
Average open rates vary by industry, usually ranging between 15 and 25 percent. If you’re seeing numbers below this it’s time to take steps to improve so that your readers see your message.
Most importantly, your email needs a compelling title. Your subject line should include dynamic wording and likely a call to action. Keep in mind that by law your title needs to be honest. The primary U.S. regulation of email is the Controlling the Assault of Non-Solicited Pornography and Marketing Act of 2003 (CAN-SPAM Act), which “bans false or misleading header information and prohibits deceptive subject lines.”
3. Unsubscribe Rate
How many people chose to unsubscribe from your list after they opened your email? That’s your unsubscribe rate. The average unsubscribe rate for an email marketing campaign is less than .5 percent.
If your rate climbs over 1 percent, it may indicate that there’s something wrong with your approach. You can look at the frequency of your emails, the kind of content you are including, and what call to action you are highlighting.
A link providing readers with the option of unsubscribing from your list is required. The CAN-SPAM Act stipulates that you “provide recipients with a method for opting out of receiving any such email in the future.” It’s also a simple way for you to make clear that you care about your audience and want them to feel empowered.
4. Click-Through Rate
How many people chose to click on a link in your email that brought them to your website? That’s your click-through rate. This alone is a success! You’ve engaged your reader with the content of your email enough that they want to see more.
One rule-of-thumb is that your click-through rate should be at least 10 percent of your open rate. So if your open rate for an email marketing campaign is 20 percent, you should expect a click-through rate of at least 2 percent. Click-through rate is traditionally considered the single most fundamental statistic to track.
In order to improve your click-through rate, take a close look at the content of your email. Is your call to action clear? Have you generated a sense of urgency, perhaps with a limited time offer? Are your graphics and layout attractive, and do they display well on mobile devices?
5. Conversion Rate
How many people took the action you wanted them to take when you created your email marketing campaign? That’s your conversion rate. While it’s a more individually defined statistic than your click-through rate, you want a similar conversion rate in excess of 2 percent.
It’s critical that you have a defined goal in mind whenever you send an email. Do you want your readers to make an e-commerce purchase or donation? Take a survey? Subscribe to your newsletter? You can craft your conversion statistics reports so that what you’re tracking best represents the results you want.
Conclusion
Email marketing campaigns allow you to drive towards your goals by creatively crafting your strategy, lists, content, and more. And they also follow a clear set of fundamental steps you can quickly and precisely track. This enables you to make data-driven decisions about what changes are needed and the impact they have.
What do your statistics tell you? Which steps in your email marketing campaigns are showing success? Are there areas where the data is showing that you need to improve? Ask the right questions and the data will provide the right answers.